Introduction
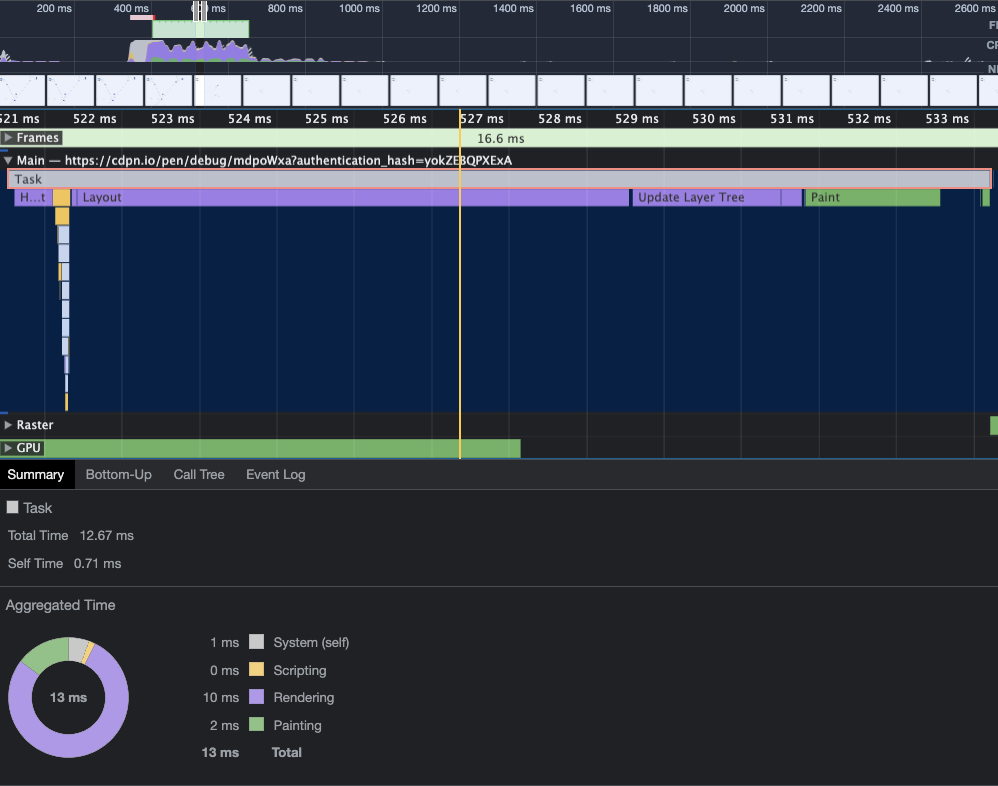
저번 시리즈에서 필요한 기능은 전부 구현해보았지만, svg 요소의 개수가 증가할수록 성능이 하락하는 모습을 확인했습니다. 50개의 nodes에 대해 DevTools로 측정해본 결과, 렌더링 연산에 굉장히 많은 CPU, GPU 작업을 필요로 하고 있었습니다.
이를 해결하기 위해서 Canvas API를 이용할 수 있습니다. Canvas API를 이용하면 d3-selection을 다룰 일은 거의 없습니다. 특히나 이번처럼 단순히 원과 선만 그리면 되는 작업에서는 그리기 더욱 쉽습니다. 대신 zoom과 drag는 구현 방식에 차이가 있어 다소 어려운 점도 있습니다. 그럼 바로 코드와 함께 저번 시간에 작성한 내용을 Canvas API로 리팩토링해보도록 하겠습니다.
이번 시리즈에선 저번 시리즈에서 완성했던 network class를 이용합니다.
Drawing Canvas
Canvas API는 말 그대로 캔버스로 볼 수 있습니다. 그 위에 그림을 그리고 수정이 필요하다면 전부 지우고 다시 그리면 됩니다. 애니메이션이라면 매 프레임마다 지우고 그리기를 반복합니다. 이처럼 d3-force 또한 매 틱마다 반복하면 됩니다.
d3.js에 대해서 중점적으로 다루는 프로젝트이므로 Canvas API에 대해 자세한 언급은 없습니다. 이에 대한 내용은 공식 문서를 참고 바랍니다.
Svg 방식에서는 svg 요소를 생성하고 tick에서 위치를 변경하는 방식으로 구현했습니다. Canvas 방식에선 그냥 그려주기만 하면 됩니다. 이를 위해 canvas와 ctx를 생성하고 tick 이벤트를 등록해봅시다.
class network {
  constructor() {
    this.canvas = d3.select("body")
      .append("canvas")
      .attr("width", this.size.w)
      .attr("height", this.size.h)
      .style("display", "block");

    this.ctx = this.canvas.node().getContext("2d");

    this.nodeRadius = 8;

    this.simulation = d3
      .forceSimulation()
      .on("tick", this.drawCanvas.bind(this));
  }

  drawCanvas() {
    this.ctx.clearRect(0, 0, this.size.w, this.size.h);
    this.ctx.save();

    this.drawLinks();
    this.drawNodes();

    this.ctx.restore();
  }

  drawNodes() {
    console.log("Drawing Nodes!");
  }

  drawLinks() {
    console.log("Drawing Links!");
  }
}drawCanvas(), drawNodes() 그리고 drawLinks() 함수 내에선 이제 d3-selection 없이 ctx만으로 그림을 그립니다. 먼저 ctx.clearRect()로 canvas를 전부 지워줍니다. 그리고 drawNodes()와 drawLinks()를 호출하여 nodes와 links를 그려줍니다. 이 때, links를 먼저 그려줘야만 nodes 뒤에 그려집니다.
links는 굉장히 간단하게 그릴 수 있습니다. links를 순회하면서 선을 그려줍니다.
drawLinks() {
  this.links.forEach(({ source, target }) => {
    this.ctx.beginPath();
    this.ctx.moveTo(source.x, source.y);
    this.ctx.lineTo(target.x, target.y);
    this.ctx.stroke();
  });
}nodes는 저번 시리즈에서 그렸던 것처럼 원 중앙에 id가 위치하도록 작성합니다.
drawNodes() {
  this.nodes.forEach(({ id, x, y }) => {
    this.ctx.beginPath();
    this.ctx.arc(x, y, this.nodeRadius, 0, 2 * Math.PI);

    this.ctx.lineWidth = 3;
    this.ctx.strokeStyle = "blue";
    this.ctx.stroke();

    this.ctx.fillStyle = "#fff";
    this.ctx.fill();

    this.ctx.textAlign = "center";
    this.ctx.textBaseline = "middle";
    this.ctx.fillStyle = "#000";
    this.ctx.fillText(id, x, y);
  });
}
d3-selection 없이 오로지 canvas만 이용하므로 쉽게 그릴 수 있습니다.
Panning and Zooming
d3-zoom을 연결해서 화면을 이동하고 확대, 축소할 수 있도록 구현하겠습니다. Svg 방식에선 요소의 transform 속성을 변경하여 직접 이동했다면, canvas 방식에선 전부 지우고 위치 이동 후 다시 그려주는 방식으로 구현합니다.
class network {
  constructor() {
    this.transform = d3.zoomIdentity;

    this.zoom = d3.zoom()
      .scaleExtent([0.1, 5])
      .on('zoom', ({ transform }) => {
        this.transform = transform;
        this.drawCanvas();
      });

    this.canvas.call(this.zoom);
  }

  drawCanvas() {
    this.ctx.clearRect(0, 0, this.size.w, this.size.h);
    this.ctx.save();

    this.ctx.translate(this.transform.x, this.transform.y);
    this.ctx.scale(this.transform.k, this.transform.k);

    this.drawLinks();
    this.drawNodes();

    this.ctx.restore();
  }
}d3.zoomIdentity는 { k: 1, x: 0, y: 0 }인 객체입니다. 이를 이용해 transform 변수를 생성한 뒤, zoom 이벤트로 얻은 transform을 저장합니다. 그 후, drawCanvas()를 호출하여 ctx.translate()와 ctx.scale() 함수를 이용해 변경한 위치에 그리도록 합니다.
Focusing
특정 요소를 클릭했을 때, 해당 요소를 포커싱하는 동작을 구현해보도록 하겠습니다. Canvas는 개별 요소를 선택할 수 없어서 요소에 커서 스타일을 적용하거나 클릭 이벤트를 적용하는데 어려움이 있습니다. 하지만, d3.js에서 제공하는 기능의 조합으로 쉽게 구현할 수 있습니다.
개별 요소가 아닌 canvas 자체에 클릭 이벤트를 등록합니다. 그렇게 얻은 event로부터 클릭 좌표를 얻어 해당 위치에 존재하는 node를 찾고, 해당 node로 이동하고 확대합니다.
class network {
  constructor() {
    this.canvas.on("click", ({ x, y }) => {
      const node = this.findNode(x, y);
      if (!node) return;

      this.canvas
        .transition()
        .duration(500)
        .call(this.zoom.translateTo, node.x, node.y)
        .transition()
        .call(this.zoom.scaleTo, 3);
    });
  }

  findNode(x, y) {
    const [ix, iy] = this.transform.invert([x, y]);
    return this.simulation.find(ix, iy, this.nodeRadius);
  }
}canvas에 click 이벤트를 등록하여 event 객체로부터 클릭한 위치인 x, y 좌표를 얻었습니다.
findNode() 메서드는 주어진 좌표에 node가 존재하는지 확인하고 해당 node를 반환합니다. transform.invert()는 주어진 절대 좌표에 현재 transform 좌표값을 포함하여 계산하고 반환합니다. 이를 이용해야만 변경된 transform을 적용한 좌표를 얻을 수 있습니다. simulation.find()는 주어진 좌표에서 가장 가까이에 위치한 node를 검색하여 반환합니다. node의 반지름을 제공하여 해당 요소를 클릭해야만 node를 찾을 수 있도록 하였습니다.
node를 찾았다면, zoom.translate로 해당 node 위치로 이동한 후 확대합니다.
Dragging
d3-drag를 연결하여 요소를 드래그하는 기능을 추가해보도록 하겠습니다. Svg 방식에서는 circles에 drag를 부착하여 모든 요소에 대해 이벤트를 등록했습니다. Canvas 방식에서는 그런 방법이 불가능하기 때문에, canvas에 등록하면서 동시에 클릭한 요소를 검색하는 subject를 설정해야 합니다.
class network {
  constructor() {
    this.drag = d3
      .drag()
      .subject(({ x, y }) => this.findNode(x, y))
      .on("start", () => {
        this.canvas.style("cursor", "grabbing");
        this.simulation.alphaTarget(0.1).restart();
      })
      .on("drag", (event) => {
        const [x, y] = d3.pointer(event);
        event.subject.fx = this.transform.invertX(x);
        event.subject.fy = this.transform.invertY(y);
      })
      .on("end", ({ subject }) => {
        this.canvas.style("cursor", "default");
        this.simulation.alphaTarget(0);
        subject.fx = null;
        subject.fy = null;
      });

    this.canvas.call(this.drag);
  }
}drag.subject()는 드래그하려는 주체 node를 선택할 때 이용합니다. findNode() 함수로 검색한 node를 subject로 설정합니다. 설정 이후, event 객체에서 subject property에 선택한 node가 등록됩니다.
Drag 이벤트에 등록한 함수는 첫 번째 인자로 event 객체를 가집니다. Canvas 방식의 경우 개별 요소가 아닌 canvas에 등록되었기 때문에 event.x와 event.y의 값이 canvas 기준으로 생성됩니다. 클릭 위치 기반으로 좌표를 가져오기 위해 event.sourceEvent 객체를 이용해야하므로 d3.pointer()를 이용해 좌표를 가져옵니다. 그리고 transform을 적용하여 subject의 고정 좌표를 변경합니다.
start와 end 이벤트에서 cursor 스타일을 변경해주고 있습니다. 다만, 요소에 마우스를 올렸을 때도 스타일을 변경해주기 위해 pointermove 이벤트를 추가해주었습니다.
class network {
  constructor() {
    this.canvas.on("pointermove", ({ x, y, buttons }) => {
      if (buttons) return;
      const node = this.findNode(x, y);
      this.canvas.style("cursor", node ? "pointer" : "default");
    });
  }
}event.buttons는 현재 마우스를 클릭한 상태인지 판별하여 드래그 중일 땐 무시하도록 합니다. node가 위치하는 곳에서만 pointer 스타일을 갖도록 합니다.
Impl.
저번 시리즈에서 작성한 코드를 Canvas로 작성해보았습니다. 이제 요소의 개수를 많이 추가하더라도 성능 하락의 모습을 보이지 않는 걸 확인할 수 있습니다.
See the Pen D3 Force (w/ Canvas) by Park, Jinyong (@jinyongp) on CodePen.
Conclusion
성능 향상을 위해 여태까지 작업했던 내용을 Canvas API로 다시 작성해보았습니다. 단순히 그려보는 건 쉬웠지만 zoom과 drag 기능을 적용하는 건 여러 시행착오를 거쳐야했고 다양한 함수를 적용할 필요가 있어 svg 구현 방식보다 어려움을 겪었습니다.
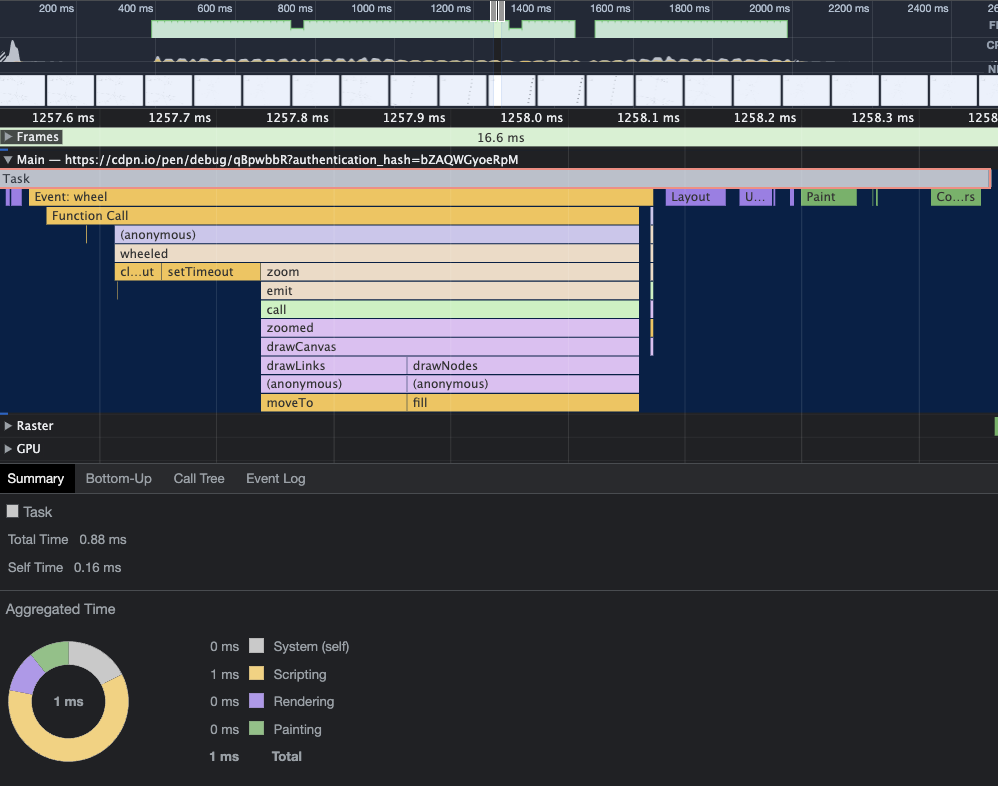
성능을 측정해보겠습니다. 50개의 node를 테스트했던 svg 방식과 달리 200개의 node를 생성하고 측정해봤음에도 굉장한 성능 향상을 보여줍니다. 대부분은 함수 실행 시간이고 랜더링 연산은 거의 영향을 미치지 않습니다.
지금까지 d3-force, selection, zoom, drag 등 다양한 d3.js 모듈을 사용해보았고 Canvas API로 작성해보며 성능 향상 또한 진행해보았습니다. d3.js에는 이 외에도 무수히 많은 모듈이 있습니다. 데이터를 시각화하는데 무궁무궁진 잠재력을 지닌만큼 더 다양하게 활용해보며 여러 프로젝트에서 활용해보시면 좋을 듯 싶습니다. 긴 글 읽어주셔서 감사합니다.